

When evaluating the New York state crime rate by city, the Law Offices of Robert Tsigler, PLLC, knows that context matters. Cities in New York have their own crime rates that change each year. Knowing the New York state crime rate by city can help residents and visitors navigate them safely.
Though New York state has plenty to offer residents and visitors alike, several factors create concerns about rising crime rates. These include population density, disparity in economic status, and concerns about a lack of suitable police presence.
However, some data shows that crime rates are trending downward. While each city may be unique in the crime problems it has and the approaches it takes to remedy them, overall data shows that New York state authorities are trying to keep these problems under control. From slight improvements in the form of lower crime rates to downward trends in key categories with momentum behind them, there are many signs that this great state is getting ahead of this problem.
Why Crime Rates Fluctuate in New York State
This data shows that major crime across New York’s biggest cities didn’t just stay down in early 2026; rather, the decline actually picked up speed, hitting record lows in several areas of The Big Apple. Crime rates tend to fluctuate each year, depending on several factors, and New York is no different. Cities in New York have their own crime rates that change each year. Knowing the New York state crime rate by city can help residents and visitors navigate safely.
What Is Crime in New York?
Crime refers to an act or a form of omission that is against the law. These actions are punishable by the authorities. Most crimes in New York and other states fall into one of two categories: violent crimes and property crimes. There are also white-collar crimes and drug-related crimes.
If a person is charged, the charge is classified as either a felony or a misdemeanor. A misdemeanor is the least serious charge of the two, resulting in lighter penalties (such as fines and jail time or alternatives to jail, such as probation or community service). Felonies are more serious and usually have minimum sentences, depending on the offense.
Sources, Definitions, and Methodology
To discuss the crime rate in New York, we first need to understand that it is calculated by dividing the number of reported incidents by the population. Then, we multiply it by 100,000 to give the number of crimes per 100,000 population.
However, comparisons based on raw totals can be very misleading, especially given that New York City has a higher population than significantly smaller cities.
To further understand what goes into those calculations, it’s also important to clarify which types of offenses are being counted. Consistent with what the New York State Division of Criminal Justice Services (DCJS) reports and the FBI Crime Data Explorer classifications, the numbers used to calculate the crime rate are heavily weighted toward index crimes. These crimes include:
- Violent index crimes, like murder, rape, robbery, and aggravated assault
- Property index crimes, like burglary, larceny, and motor vehicle theft
These standardized categories allow for cross-jurisdiction comparisons, though local charging decisions are governed by New York Penal Law and any related criminal defense laws.
Why These Numbers Might Differ Across Multiple Sources
Crime data can vary between city police departments, DCJS publications, and the FBI Crime Data Explorer. This is because the NYPD and other agencies record offences according to the definitions of NYS Penal Law, and those records are then later translated into Uniform Crime Reporting (UCR) or National Incident-Based Reporting System (NIBRS) categories for federal reporting.
This translation process can create discrepancies, as agencies may report data late or differently, revise submissions, or update their classification standards in response to shifts in reporting systems.
We update our numbers when the New York State Division of Criminal Justice Services (DCJS) releases new full-year crime data, which typically occurs annually. In addition, major city police departments publish year-end summaries that are incorporated to help with accuracy.
Crime Trends Across Major Cities in New York
It is well-known that New York City is by far the most populous city in New York State. Other notable cities include Rochester, Albany, and Buffalo. All of these see various incidents of crime throughout the year.
New York City Crime Rates
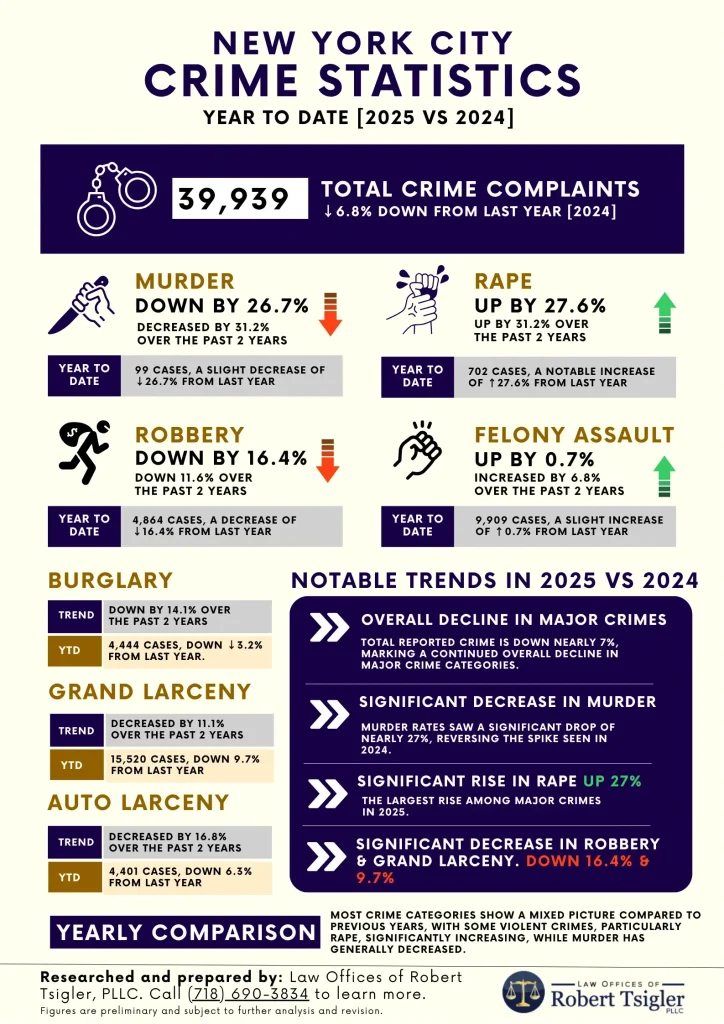
New York City had already experienced a decline in some categories of crime when comparing 2025 data to 2026 information. For the year-to-date data available, there is a 5.85% decrease in the overall crime index, resulting in 1,416 fewer incidents compared to the same period in 2026.
NYPD crime complaints can be broken down as follows:
| Year to Date | 2025 | 2026 |
| Murder | 144 | 111 |
| Rape | 910 | 971 |
| Robbery | 6,484 | 5,740 |
| Felony Assault | 13,237 | 13,254 |
| Burglary | 5,782 | 4,807 |
| Grand Larceny | 20,404 | 19,556 |
| Grand Larceny Auto | 5,795 | 5,233 |
While crime did increase in select categories, 2026 has shown improvements in various areas as well. These improvements could be due to a number of factors, including a more dedicated approach to prosecution by New York State’s legal system.
Rochester Crime Rates
Rochester remains a problem area in New York, though the entire city does not reflect prevailing statistics. For example, the area has a higher crime rate than 94% of major U.S. cities, and it is 86% above the national average. This means your chances of becoming victimized in an act of violent crime are about 1 in 166, and you face a 1 in 26 chance of suffering a property crime. These are 59% and 106% higher than the categories’ respective national averages.
Violent crime is most common in Rochester’s northeast, northwest, and southwest Crescent neighborhood regions. However, the news isn’t all bad. Areas like Oakgrove earn an A+ safety grade, showing a variation in crime probability, depending on where you are in Rochester. This also shows how crime rates can dramatically change for individual areas over time, reflecting the importance of constant attention to crime and safety.
Buffalo Crime Rates
Buffalo has shown a big dip in crime rates so far in 2026. The Buffalo Police Department noted a drop in several crime rates so far when compared to 2025, including the following categories:
- Shooting incidents are down 71%.
- Shooting victims are down 75%.
- Individuals killed by gun violence are down 80%.
The city of Buffalo has seen significant declines in certain crimes throughout 2024, including shootings, robberies, and homicides. In 2024, there were over 150 shooting victims compared to over 350 in 2020 and 2021. 2024 also saw 30 homicides. This number was nearly doubled in 2021 and 2022. In addition, motor vehicle thefts dropped, but overall theft increased.
Albany Crime Rates
Albany, the state’s capital, also experienced a decline in crime rates across 2024 as compared to 2023. There was a 15% decrease in all crimes. Murders fell 40%, while property crimes saw an overall decrease, including robberies and larcenies. However, a few crimes increased. For instance, rape reports increased by 32% as compared to 2023.
A Look at Crime in the New York Transit System
New York City is known for its public transit system, which helps the city’s bustling population commute more efficiently. This is often seen as a preferable alternative to its congested roadways, which can be hard to navigate in a timely and predictable manner.
However, the public transit system can produce some crime risks. The abundance of people, a lack of available police nearby, and the ability to commit a crime and flee quickly all raise the risk that people may be victimized.
According to the NYPD, March 2026 already saw complaints in transit environments reach 439 in total across different areas, with crimes including assault, harassment, robbery, and more. If your rights were violated in a public transit environment, you may have grounds for a criminal defense case, just as you would if the incident happened at home, at work, or on the street.
The Surge in Grand Larceny Auto and Retail Theft
Property crime trends across New York have been increasingly shaped by organized retail theft operations and rising vehicle theft rates. Retailers in major metropolitan areas, including New York City, have reported losses linked to organized theft rings that target high-value merchandise. Common targets include:
- Cosmetics
- Electronics
- Designer goods
Products that are easily resold can be a target for these actions, and it’s common for networks of thieves to pass products on for resale through their own internal distribution frameworks. This has created a greater push for security in stores, even for those that haven’t been targeted yet.
At the same time, law enforcement agencies have seen a significant increase in auto thefts in past years. This has been linked to widely publicized vulnerabilities affecting certain Kia and Hyundai models, which were targeted nationally due to security flaws. These flaws made them easier to steal, and social media amplified the issue and gave rise to more cases of theft.
The Growing Fear of Hate Crimes
Hate crimes have become a massive problem in New York, and the continued fear about their escalation has officials wondering how to address the problem.
The U.S. Department of Justice notes that crimes motivated by race, ethnicity, or ancestry totaled 334 in 2023. This constituted a slight dip from 2022, but it is a massive increase since 2021. Similar trends were shown for crimes targeting people based on their religion or gender identity.
Religion was the top bias motivation category, accounting for over 50% of incidents, with race, ethnicity, and ancestry encompassing about 32%. These issues show a need for greater law enforcement efforts to protect vulnerable individuals.
Gun Violence and the GIVE Initiative
The Gun Involved Violence Elimination (GIVE) initiative has been used to promote safer streets with fewer firearm-related incidents. The initiative supports 28 police departments and district attorneys’ offices, along with other organizations across 21 counties.
Gun crime rates have dropped to historic lows in cities like Albany, Buffalo, Rochester, and Syracuse. While some work still needs to be done to bring these rates down further, a combination of solid policing and initiatives like GIVE to empower these enforcement efforts can continue to make cities safer.
Shooting incidents have followed a unique pattern in the past half-decade:
- In 2020 and 2021, shooting incidents nearly doubled from 776 to 1,531.
- In 2022 and 2023, law enforcement efforts brought shootings down to 974.
- As of 2024, shootings were down to 903, with 377 homicides.
These numbers show movement in the right direction. Especially in larger cities with denser populations and more risk, GIVE can drive meaningful long-term change.
Recent Changes That Impact Criminal Law
Laws are constantly evolving. Sometimes new laws are enacted, or existing ones are updated to keep up with the times. One new law is the Clean Slate Act.
The Clean Slate Act requires some criminal records to be sealed as of November 16, 2024. Under this law, eligible crimes can be sealed after 8 years, while many misdemeanors can be sealed 3 years after sentencing or release. Background checks and job prospects for people with past convictions are greatly impacted by this law.
Currently pending in the legislative process, Senate Bill 2025-S4768 aims to change the penal code by making the solicitation or facilitation of specific crimes a designated offense for the purposes of hate crimes. This would increase the range of offenses covered by hate crime laws if it were passed.
Factors That Affect Crime Rates
Crime rates are influenced by several factors that all work together. These are usually social, economic, and environmental. Some factors that influence crime rates include:
- Economics. Circumstances such as high unemployment, poverty, and low income all contribute to crime rates. When individuals’ basic needs are not met, they are more likely to commit crimes to meet them, especially property crimes.
- Policing. Weak or nonexistent police forces lead to increased crime, as the repercussions are low or nonexistent. This also can include police injustice, when tensions may rise in the community, leading to increased crime in the area.
- Educational access. When areas do not have adequate schooling, programs, and treatment services (especially for addiction and mental health), this can result in increased crime rates, especially among juveniles.
- Urban density. While being in an urban area does not directly lead to increased crime, large cities have higher populations, which could lead to more crime than in places with smaller populations.
Seeking Legal Counsel When Accused of a Crime
If you or someone you know has been accused of a crime in New York, it is important to seek legal help right away. A criminal lawyer can protect you against illegal searches and safeguard your rights. They can explain you understand the charges against you and advocate for an optimal outcome, such as reduced charges or dismissals. An attorney can also advocate for you in court and negotiate on your behalf.
Additionally, court-based Help Centers offer information about the law. They can also inform you of court procedures. While they do not typically provide legal advice, these centers can help with navigating the court system.
FAQs
Q: Can Crime Rates Affect Bail Decisions in New York?
A: No, crime rates themselves don’t affect bail decisions in New York. Judges evaluate statutory factors, such as the risk of flight, the nature of the charges, and the defendant’s criminal history, when making a decision. Depending on the circumstances of your case, the safety of the community may also be considered.
Q: Are Juvenile Crime Statistics Included in Citywide Crime Rates?
A: No, juvenile crime statistics aren’t always included in citywide crime rates. This is because juvenile matters are often handled in specific courts, and reporting practices can vary depending on the charge and the accused’s age. Some incidents involving juveniles might appear in the crime data, while others are processed separately under youth offender statutes.
Q: Can Crime Data Be Used as Evidence in a Criminal Trial?
A: No, crime data can’t be used as evidence in a criminal trial, as courts focus on direct evidence like forensic findings, witness testimony, and legally obtained statements. That said, statistical trends can help your New York criminal defense attorney, as statistics can reveal aggressive policing, quota pressures, or targeted enforcement initiatives.
Q: How Long Does a Criminal Case Typically Take to Be Resolved in New York?
A: How long it takes to resolve a criminal case in New York varies widely, as the timeline can depend on:
- The type of charges
- The severity of said charges
- The court’s schedule
- The amount of evidence that’s available
- Whether the matter resolves by plea or trial
Your attorney can provide an estimate of how long your case may last.
Hire a Criminal Defense Lawyer You Can Trust
If you have been charged with a crime in New York, you need to hire a criminal defense lawyer in NYC from the Law Offices of Robert Tsigler, PLLC. Our team can represent you throughout the upcoming legal process, using our extensive knowledge of criminal defense laws to protect your rights. Contact us today to get started.